was the best year on record for ozone concentrations in the Bay Area
Ozone levels are more than one-third lower today than at their high point in the 1970s
Introduction
How is the fight against smog going?
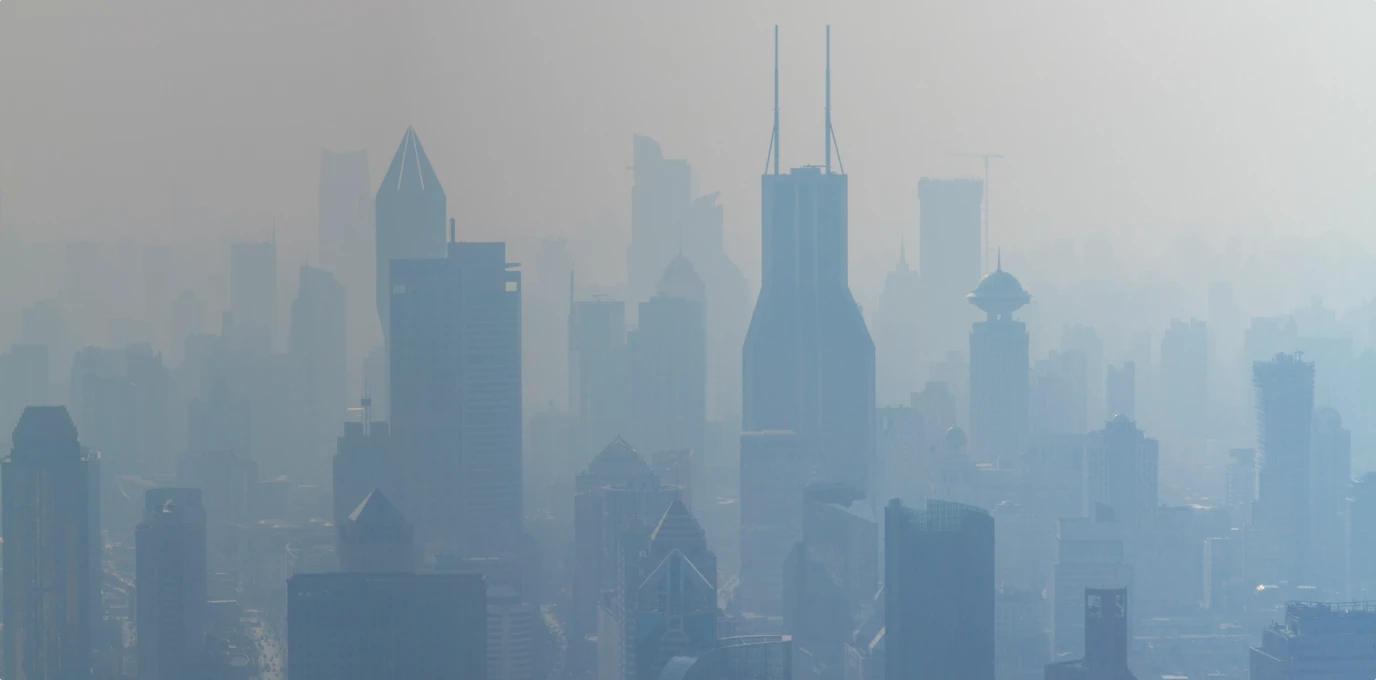
Ground-level ozone, commonly known as smog, is formed when emissions of ozone precursors from power plants, factories, cars and other sources react with sunlight in the atmosphere. While declining emissions of ozone precursors in recent years has reduced smog in many communities across the country, current ozone concentrations still affect public health, particularly on hot summer days. Reducing smog has been one of the Bay Area's major public policy priorities for many decades.
Regional Performance
Even with significant population and economic growth, Bay Area ozone concentrations have declined over the past half-century.
Peak Bay Area ozone concentration levels are well below those first recorded when air quality monitoring began more than 50 years ago. Thanks in part to cleaner cars and trucks, ozone concentrations today are at least one-third lower than 1970s levels. These improved conditions have come about despite growth in population, vehicles and miles traveled in the Bay Area. Since the early 2000s, Bay Area ozone concentrations have consistently been one-third lower than in the 1970s. At the same time, however, ozone concentrations can vary from year to year depending on weather conditions. In the last two years, the weather was unfavorable and as a result concentrations in the region's worst affected locations ticked upward. Based on these recent data, the Bay Area exceeds the new, more stringent federal standards for ozone.
Local Focus
Ozone readings vary widely across the region, with inland areas showing the highest levels of this pollutant.
Due to prevailing winds and weather conditions, ozone from motor vehicle emissions and industrial sources in the center of the region accumulates in inland communities. Eastern Contra Costa, eastern Alameda, and southern Santa Clara counties are particularly affected by ozone. Conditions continue to be especially high in Livermore and San Martin, for example. In contrast, the region's second- and third-largest cities, San Francisco and Oakland, had the lowest concentrations of ozone. Given that the majority of the region's population lives in the urban core of the region, this means that ozone exposure is well within the federal standards for most Bay Area residents.
Livermore and San Martin air monitoring sites have the highest ozone levels in the region, at over 70 parts per billion
Ozone levels at Oakland and San Francisco air monitoring sites are under 55 parts per billion, the lowest in the region
Sources & Methodology
Data is collected at specific sensor sites operated by the Air District that capture the concentration of ozone in the air; sensor locations may change over the years and thus only minor relocations are shown as the same station in this analysis (e.g., sensor moved across the street from its prior location). Data are used to calculate the eight-hour peak concentration for ozone. The fourth-highest day of the year is identified and then reported as a three-year rolling average to minimize the impact of short-term variations in weather conditions in any given year. This average is compared to the national air quality standard to determine compliance. The site with the highest ozone level may shift from year to year depending on which sensor location had the highest levels of ozone over that particular time period.
For current air quality data, refer to the Bay Area Air Quality Management District's website.